Regulatory T cell profiles in patients with N-methyl-ᴅ-aspartate receptor-antibody encephalitis
Article information
Abstract
Purpose
Purpose Regulatory T cells (Tregs) have been implicated in the pathogenesis of several autoimmune disorders and used in adoptive cell transfer therapies. Neither have been explored in patients with autoimmune encephalitis where treated patient outcomes remain suboptimal with frequent relapses. Here, to identify new treatment strategies for autoimmune encephalitis, we sought to evaluate the proportion of circulating Tregs and Treg subpopulations in peripheral blood of patients with N-methyl-ᴅ-aspartate receptor-antibody encephalitis (NMDAR-Ab-E) and compared this with healthy controls.
Methods
We compared the phenotype of peripheral blood Tregs in four adult NMDAR-Ab-E patients and four age- and sex-matched healthy controls using an 11-color flow cytometry assay panel for characterization of Tregs (CD4+ CD25+ FoxP3+) cells into naïve (chemokine receptor [CCR] 7+ CD45RA+), central memory (CCR7+ CD45RA–), and effector memory (CCR7– CD45RA–) cells. We also examined and compared the expression of the CCR6 by circulating Tregs and the respective Treg subpopulations between the study groups.
Results
The proportion of circulating Tregs was similar between patients with NMDAR-Ab-E and healthy controls but the proportion of naïve Tregs was lower in NMDAR-Ab-E patients (p = 0.0026). Additionally, the frequency of circulating effector memory Tregs was higher, and the proportion of circulating effector memory Tregs expressing CCR6 was lower, in NMDAR-Ab-E patients compared with healthy controls (p = 0.0026).
Conclusion
Altered Treg homeostasis may be a feature of patients with NMDAR-Ab-E. Future studies with larger samples are warranted to validate these findings.
Introduction
Autoimmune encephalitis (AIE) occurs due to a misdirected immune response against self-antigens expressed in the central nervous system (CNS). When the resulting autoantibodies target membrane surface antigens, they are considered potentially pathogenic. This is the case for N-methyl-ᴅ-aspartate receptor antibody encephalitis (NMDAR-Ab-E), a common form of autoimmune encephalitis characterized by psychosis, amnesia, seizures, and dyskinesias, where antibodies target the extracellular domain of the NR1 subunit of the NMDAR. While B cells are likely to be key to an autoantibody-mediated pathology, T cell functions and imbalances between several limbs of an acquired immune system are likely to have both pathogenic and therapeutic roles [1]. For example, in the NMDAR-Ab-E–associated ovarian teratomas, dense infiltrations of both T and B cells are observed [2].
Patients with NMDAR-Ab-E show variable responses to treatment and ~20% of patients suffer disease relapses after first-line immunotherapies [3], indicating the need to identify alternative treatment approaches. Th17 cells play a pathogenic role in the development of autoimmune diseases through production of proinflammatory cytokines that cause tissue damage. Excessive activation of the Th17 pathway has been implicated in the immunopathology of NMDAR-Ab-E [3,4]. Notably, an increase in cerebrospinal fluid (CSF) concentration of the Th17 inflammatory cytokines interleukin (IL) 17 and IL6 was observed in NMDAR-Ab-E patients [3]. Additionally, Zeng et al. [3] found an increased number of Th17 CD4 T cells in the CSF of NMDAR-Ab-E patients. Thus, a common paradigm for intervention with the greatest presumptive benefit in AIE, and indeed NMDAR-Ab-E, should center on early attenuation of the underlying CNS inflammation.
Regulatory T cells (Tregs) are T cells that suppress inflammatory and autoimmune responses promoting immune tolerance, a function proven to be critical for the control of several autoimmune diseases. Treg deficiencies can lead to microglial activation, inflammation, and neuronal injury. Poorly functioning Tregs and/or reduced Treg numbers have been observed in patients with autoimmune diseases including multiple sclerosis and vasculitides [5,6]. Restoring immune homeostasis and tolerance through activation or adoptive transfer of Tregs has become an attractive approach for the treatment of several autoimmune diseases [7,8]. A better understanding of the role of Tregs in NMDAR-Ab-E could shed more light on the potential utility of Treg-directed treatment strategies or indeed provide evidence to support repurposing of already existing treatments to improve outcomes for affected patients.
The objective of this study was to evaluate the proportion of Tregs in peripheral blood of affected patients compared with healthy controls. Given the reciprocal relationship between Th17 cells and Tregs [9] and data supporting activation of the Th17 pathway in NMDAR-Ab-E [3,4], we hypothesized that the frequency of Tregs in peripheral blood would be lower in NMDAR-Ab-E patients than in healthy controls, suggesting a loss of immune tolerance in affected patients.
Methods
Study cohort
All clinical investigations were conducted according to the Declaration of Helsinki principles. The Ethical Committee of Yorkshire and The Humber approved the study protocol (No. REC16/YH/0013) and written informed consent was obtained from all participants. Enrolled participants were admitted to the John Radcliffe Hospital, Oxford, UK with a definitive diagnosis of NMDAR-Ab-E based on clinical symptoms and positive CSF NMDAR antibodies. Age- and sex-matched healthy controls were identified through a mail out to staff working at the Oxford Vaccine Group, Oxford, UK.
Sampling
Peripheral blood mononuclear cells (PBMCs) were isolated from heparinized peripheral blood samples by Ficoll gradient centrifugation and stored in liquid nitrogen until thawing.
Cell staining and flow cytometric analysis
Eleven-color flow cytometry was used to identify Tregs and the various Treg subsets. In brief, PBMCs were washed twice in phosphate-buffered saline, and then stained (30 minutes on ice) with Brilliant violet (BV) 711 anti-human CD3 (Clone UCHT1; Biolegend, San Diego, CA, USA), BV510 anti-human CD4 (Clone SK3, Biolegend), BV788 anti-human CD25 (Clone MA251; BD Biosciences, San Jose, CA, USA), BV650 anti-human CD45RA (Clone HI100, Biolegend), and with the following chemokine receptors: BV605 labeled CCR6 (Clone G04E3, Biolegend) and BV421 labeled CCR7 (Clone G043H7, Biolegend). After staining for surface molecules, intracellular staining was performed with allophycocyanin labeled mAB against FoxP3 (Clone PCH101; eBioscience, San Diego, CA, USA) and PeCF594 mAB against cytotoxic T-lymphocyte-associated protein (CTLA) 4 (Clone BN13, BD Biosciences), using a fixation and permeabilization solution (eBioscience) according to the manufacturer’s instructions. Then the cells were washed twice and analyzed with a Fortessa X20 flow cytometer (Becton Dickinson, San Jose, CA, USA) using FACS Diva V8.0 software (Becton Dickinson).
Definitions
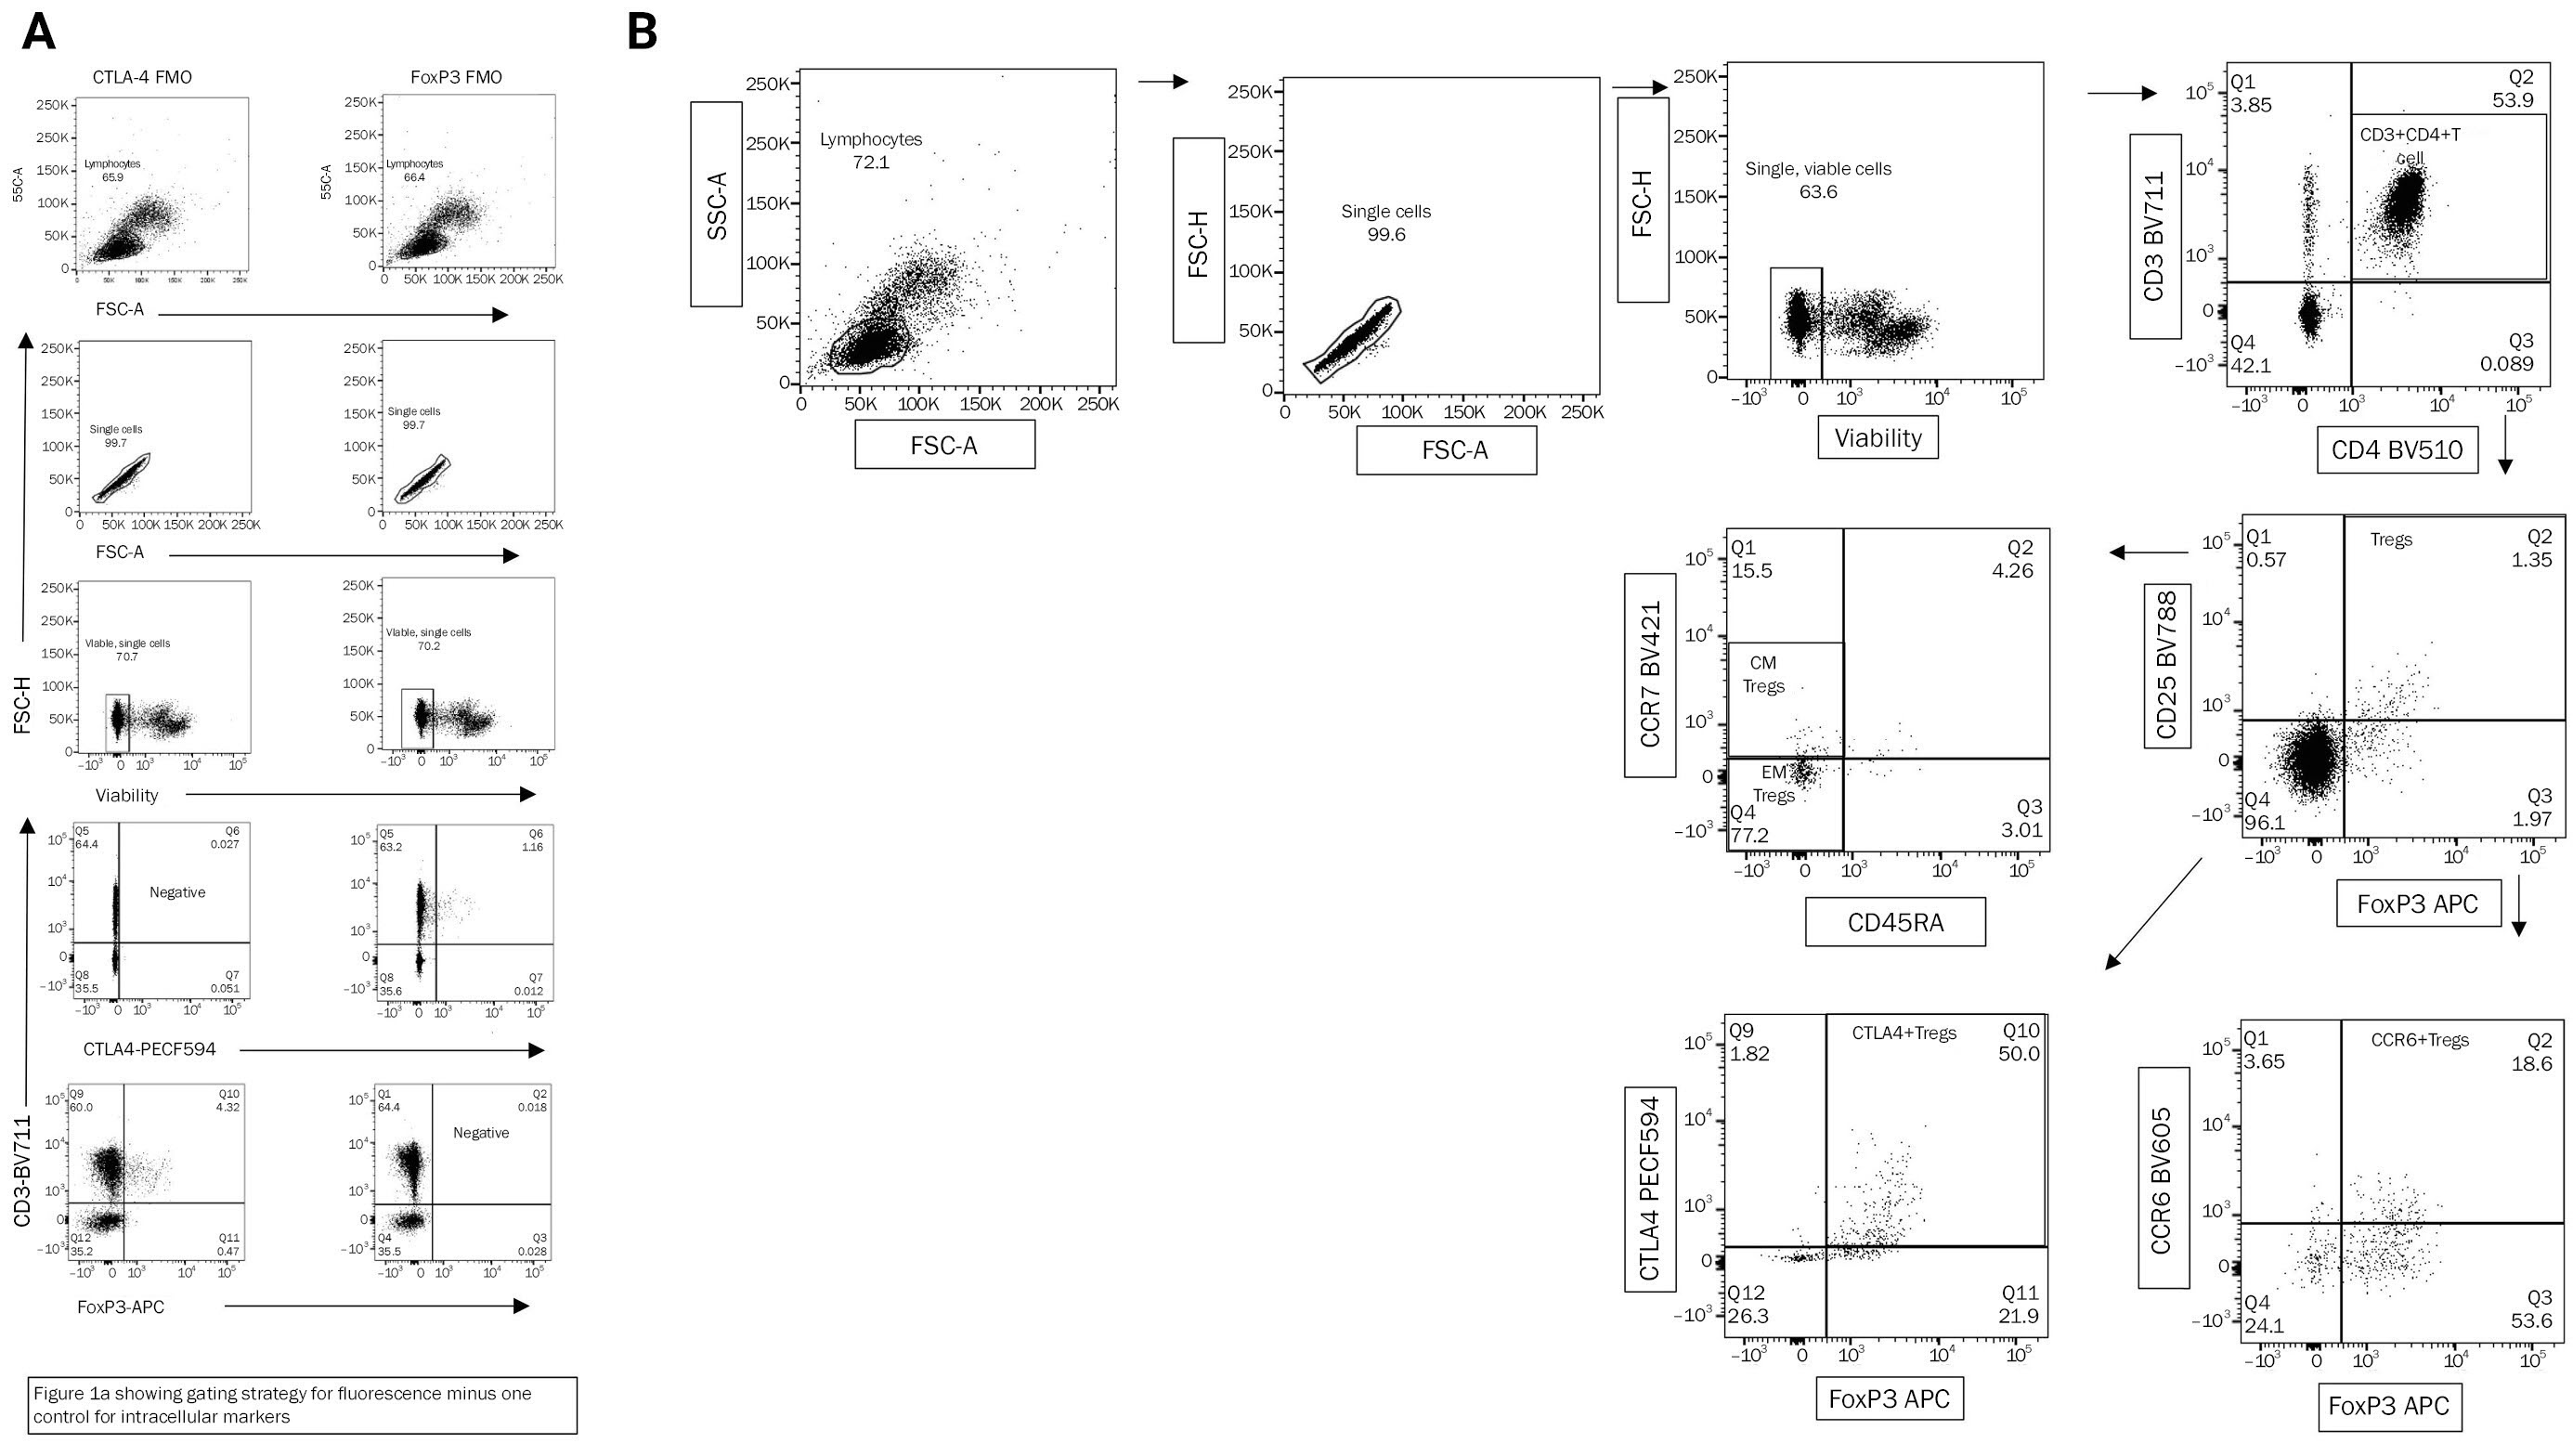
Tregs were identified by flow cytometry based on the expression of CD25 and FoxP3 on T (CD3+ CD4+) cells. The Treg population was then classified into different subpopulations based on their expression of additional cell surface and intracellular markers, as described elsewhere [10] (Gating strategies in Figure 1A and B) into: (i) naïve Tregs (CD3+ CD4+ CD25+ FoxP3+ CD45RA+), (ii) memory Tregs (CD3+ CD4+ CD25+ FoxP3+ CD45RA–), (iii) effector memory (EM) Tregs (CD3+ CD4+ CD25+ FoxP3+ CD45RA– CCR7–), and (iv) central memory (CM) Tregs (CD3+ CD4+ CD25+ FoxP3+ CD45RA– CCR7+). The expression of the activation marker CTLA on Tregs and the homing marker CCR6 were also evaluated.
Gating strategy
(A) Gating strategy for fluorescence minus one control for intracellular markers. (B) Gating strategy used for identification of regulatory T cells (Tregs) and the different subpopulations. Subsequent gating is done on the population highlighted either in the circle of rectangle in the preceding figure. CTLA, cytotoxic T-lymphocyte associated protein 4; FMO, fluorescence minus one control; SSC, side scatter; FSC, forward scatter; PECF, 1,2-dioleoyl-sn-glycero-3-phosphoethanolamine-N-(carboxyfluorescein); APC, allophycocyanin; CCR, chemokine receptor. Tregs, CD3+ CD4+ CD25+ FoxP3+; memory Tregs, CD3+ CD4+ CD25+ FoxpP3+ CD45RA–; effector memory (EM) Tregs, CD3+ CD4+ CD25+ FoxP3+ CD45RA– CCR7–; central memory (CM) Tregs, CD3+ CD4+ CD25+ FoxP3+ CD45RA– CCR7+.
Statistical analysis
Data are presented as median and interquartile ranges (IQRs). The proportions of the Treg populations were compared between NMDAR-Ab-E patients and healthy controls using the Wilcoxon-Mann-Whitney (nonparametric) test. Spearman correlation analysis was used to test for statistical dependence between Treg populations. GraphPad Prism version 7.0 (GraphPad Software, San Diego, CA, USA) was used for the statistical calculations. A p-value of <0.05 was considered statistically significant.
Results
Study participants
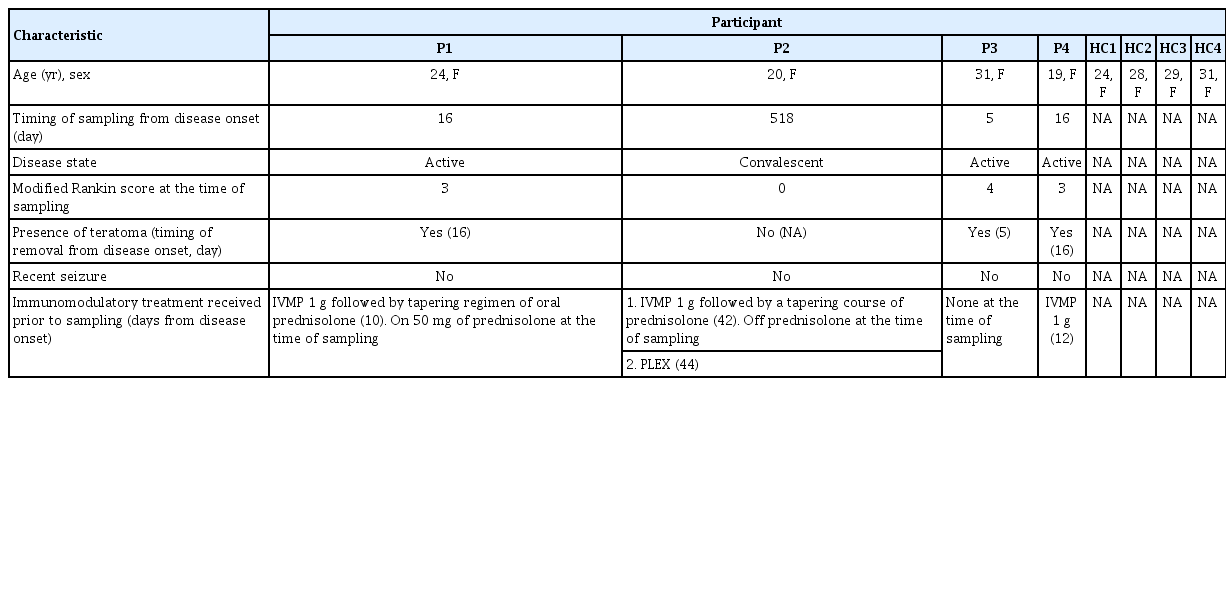
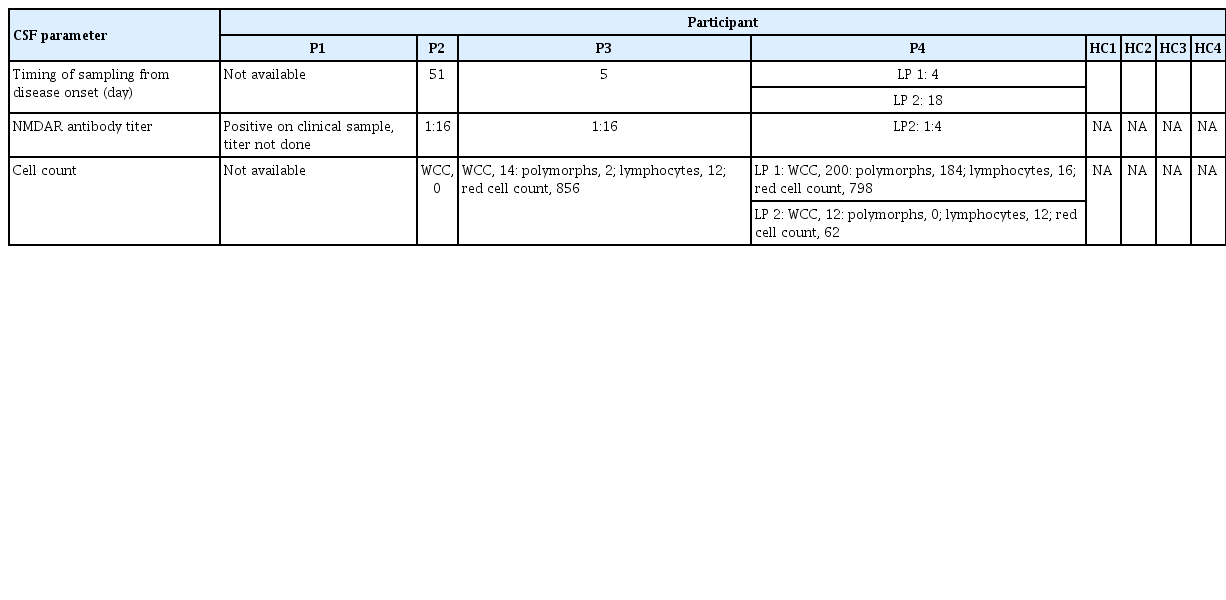
Eight participants were included in this study: four patients with NMDAR-Ab-E and four age- and sex-matched healthy controls (Table 1). Patient samples were obtained either in the acute (n = 3) or convalescent (n = 1) phase of the disease. Clinical characteristics of the NMDAR-Ab-E patient cohort are provided in Tables 1 and 2. Three of the four NMDAR-Ab-E patients had received at least one immunomodulatory treatment (intravenous methylprednisolone, n=3; oral prednisolone, n=2; and plasma exchange, n=1), prior to sampling (Table 1). All patients were female. The mean age (±standard deviation) of the study population was 23.50 years (±5.447) and 28.00 years (±2.944) for the NMDAR-Ab-E and healthy control groups, respectively.
Comparison of peripheral lymphocyte counts between NMDAR-Ab-E patients and healthy controls
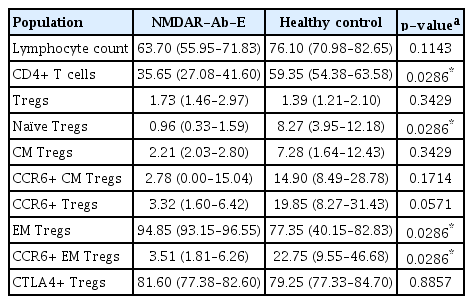
Firstly, we compared the frequency of total lymphocytes between NMDAR-Ab-E patients and healthy controls and found no significant differences (p = 0.0571) (Figure 2A and Table 3).
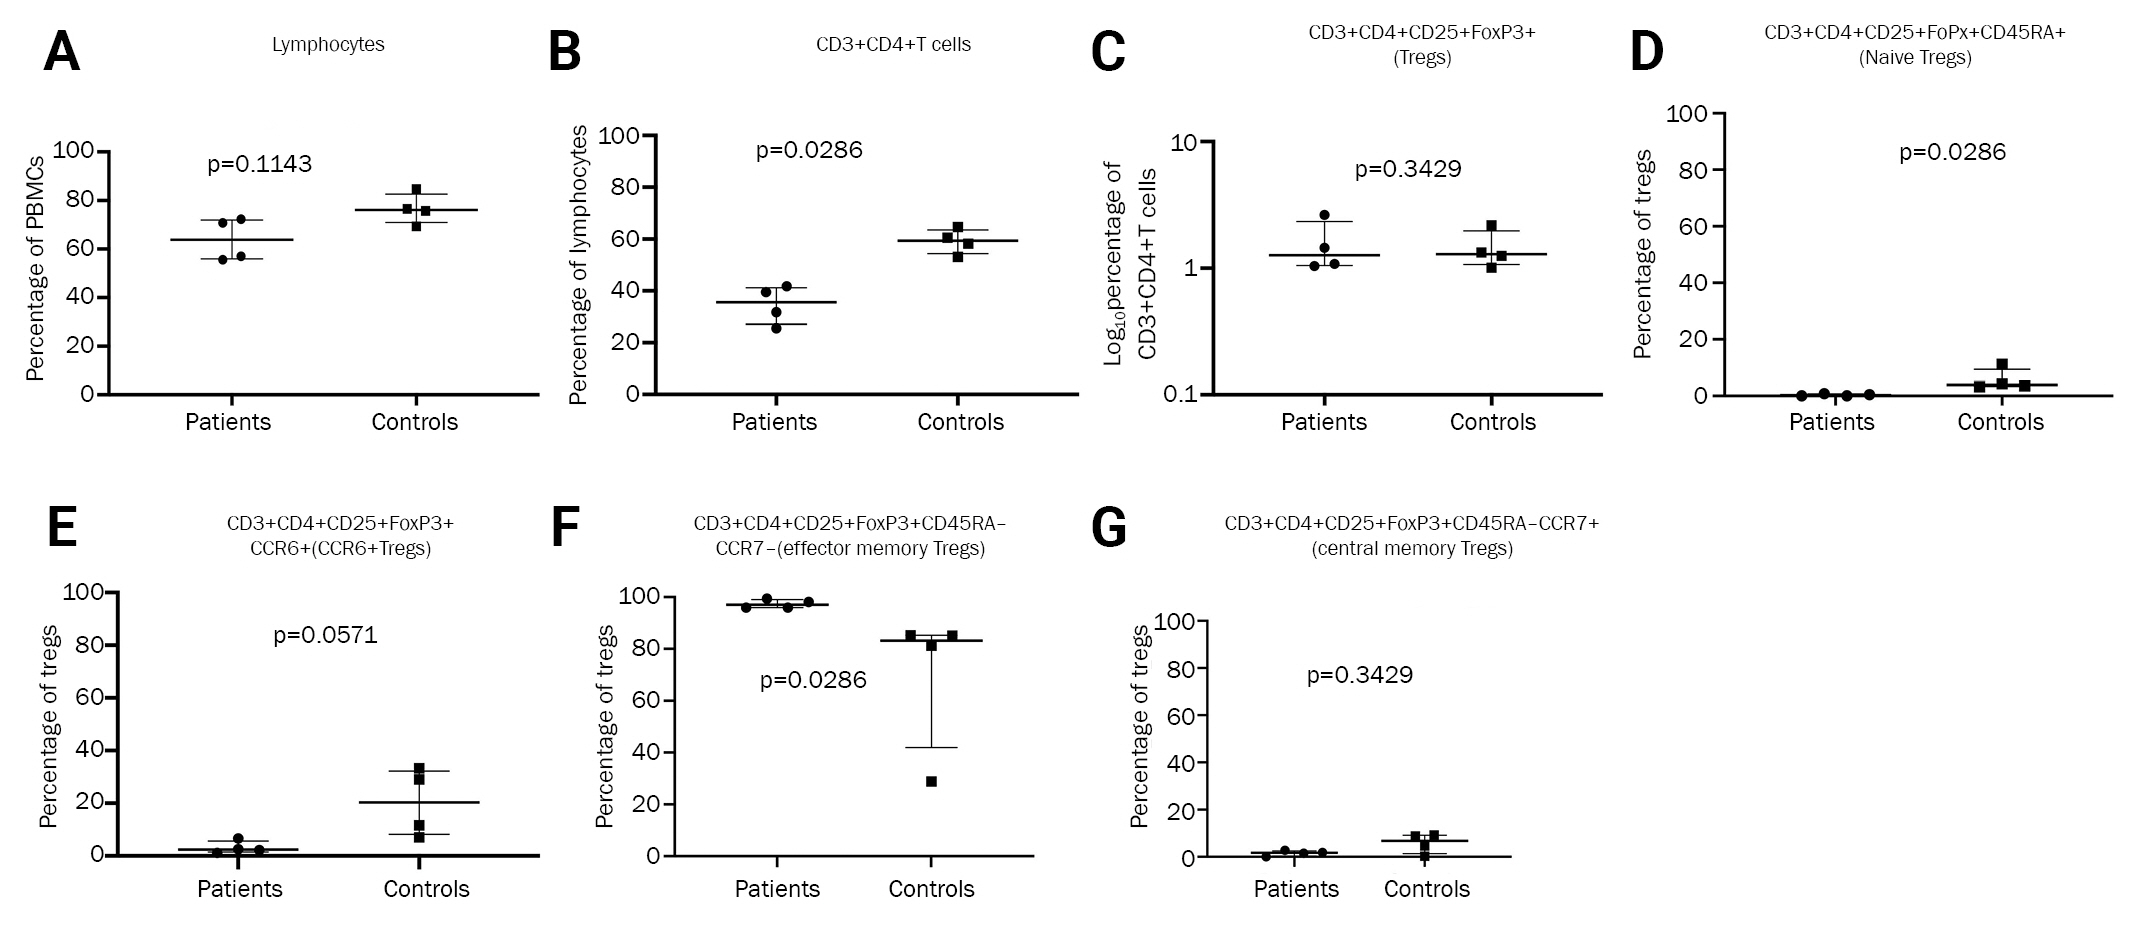
Comparison of different cell populations between NMDAR-Ab-E patients and healthy controls
(A) Lymphocyte comparison between NMDAR-Ab-E patients and healthy controls. (B) Comparison of proportion of CD3+ CD4+ T cells between NMDAR-Ab-E patients and healthy controls. (C) Comparison of proportion of Tregs between NMDAR-Ab-E patients and healthy controls. (D) Comparison of proportion of naïve Tregs between NMDAR-Ab-E patients and healthy controls. (E) Comparison of proportion of Tregs expressing CCR6 between NMDAR-Ab-E patients and healthy controls. (F) Comparison of proportion of effector memory Tregs between NMDAR-Ab-E patients and healthy controls. (G) Comparison of proportion of effector memory Tregs expressing CCR6 between NMDAR-Ab-E patients and healthy controls. (H) Comparison of proportion of central memory Tregs between NMDAR-Ab-E patients and healthy controls.
NMDAR-Ab-E, N-methyl-ᴅ-aspartate receptor-antibody encephalitis; PBMC, peripheral blood mononuclear cell; CCR, chemokine receptor; Tregs, regulatory T cells.
NMDAR-Ab-E patients have a lower frequency of circulating CD3+ CD4+ (helper T) cells compared with healthy controls
Next, we compared the proportion of helper T cells and found NMDAR-Ab-E patients had a significantly lower proportion of CD3+ CD4+ T cells than healthy controls: 35.65% (IQR, 27.08–41.60) vs. 59.35% (IQR, 54.38–63.58), respectively (p = 0.0286) (Figure 2B and Table 3).
No difference in overall proportion of Tregs but diminished proportion of naïve Tregs in NMDAR-Ab-E patients compared with healthy controls
Next, we compared the frequency of Tregs between the study groups. While there was no difference in the proportion of circulating Tregs between the groups (p = 0.3429), NMDAR-Ab-E patients had an 8-fold lower proportion of circulating naïve Tregs than did healthy controls: 0.960% (IQR, 0.33–1.59) vs. 8.265% (IQR, 3.95–12.18), respectively (p = 0.0286) (Figure 2C and D; Table 3). The proportion of CCR6+Tregs tended to be lower in NMDAR-Ab-E patients compared with healthy controls although the difference did not reach statistical significance (p = 0.0571) (Figure 2E).
NMDAR-Ab-E patients have a higher proportion of circulating effector memory Tregs compared with healthy controls
We examined whether the proportions of the predefined Treg subpopulations differed between NMDAR-Ab-E and healthy controls. NMDAR-Ab-E patients had a significantly higher proportion of circulating EM Tregs than did healthy controls: 94.85% (IQR, 93.15–96.55) vs. 77.35% (IQR, 40.15–82.83), respectively (p = 0.0286) (Figure 2F and Table 3). However, the proportion of CCR6+ EM Tregs was six times lower in NMDAR-Ab-E patients compared with healthy controls: 3.505% (IQR, 1.81–6.26) vs. 22.75% (IQR, 9.55–46.68), respectively (p = 0.0286) (Figure 2G). There was no correlation between total EM Treg and CCR6+ EM Treg frequency either in the NMDAR-Ab-E patients (Spearman r = –0.600, p = 0.4167) or healthy controls (r = –0.8, p = 0.33). The proportion of CM Tregs was similar between NMDAR-Ab-E patients and healthy controls (p = 0.3429) (Figure 2H).
Discussion
Our data show differences in the frequency of naïve Tregs, EM Tregs, and CCR6+ Tregs between NMDAR-Ab-E patients and healthy controls, without differences in the proportion of total Tregs.
We observed that patients with NMDAR-Ab-E have a lower circulating pool of naïve Tregs than healthy controls. Naïve Tregs differentiate into activated Tregs following antigenic exposure and are required to control immune responses through continuous replenishment of the activated Treg pool [11]. The lower frequency of naïve Tregs in NMDAR-Ab-E patients could indicate impaired Treg homeostasis due to an influence of Treg thymic development, or an increase in peripheral cell turnover and subsequent conversion to memory Tregs. The latter would seem more plausible due to the higher proportion of memory Tregs observed in NMDAR-Ab-E patients compared with healthy controls (data not shown).
One cross-sectional observational study of 29 patients with autoimmune encephalitis showed a nonsignificantly lower proportion of Tregs in peripheral blood of patients with synaptic antibodies (NMDAR-Ab-E, n = 4) compared with those with paraneoplastic antibodies [12]; no healthy controls were included in the study making it impossible to ascertain to what extent these differences are directly reflective of the underlying diagnosis. Although our data show that NMDAR-Ab-E patients have similar levels of circulating Tregs as healthy controls do, this finding may not necessarily reflect the Treg numbers in the CNS.
The results of this study indicate that NMDAR-Ab-E patients have a higher proportion of circulating EM Tregs than healthy controls. Contrary to their CM counterparts, EM Tregs represent more recently activated memory Tregs with increased suppressive function. Most of the NMDAR-Ab-E patients were in the active state of the disease; therefore, the higher proportion of EM Tregs in the patient cohort would suggest recent antigen reexposure with a significant shift towards an EM phenotype.
Though there was no difference in the overall proportion of Tregs between NMDAR-Ab-E patients and healthy controls, there was a trend towards a lower proportion of circulating CCR6+ Tregs in NMDAR-Ab-E patients. Also, we observed that the frequency of EM Tregs expressing CCR6 was lower in NMDAR-Ab-E patients than in healthy controls. Following antigenic stimulation, activated naïve T cells acquire specific homing receptors which allow them to efficiently migrate into peripheral tissues and sites of inflammation. Treg-mediated suppressive function involves Treg migration to lymphoid organs and to sites of inflammation where they act directly to control potentially destructive immune responses in inflamed tissues and prevent organ-specific autoimmune diseases [13]. CCR6 promotes Treg migration to inflamed sites through its physiological ligand macrophage inflammatory protein-3 alpha/CC chemokine ligand 20 (CCL20). CCR6+ memory Tregs have been shown to exhibit superior suppressive activity [14] and experimental studies indicate that CD4+ Tregs require CCR6 to downregulate the inflammatory process associated with experimental autoimmune encephalomyelitis [15]. In a study of 60 patients with NMDAR-Ab-E, significantly increased levels of CCR6 and CCL20 were observed in the CSF of NMDAR-Ab-E patients compared with patients with noninflammatory neurological disorders [3]. This finding is supported by earlier studies showing accumulation of CCR6+ Tregs and increased levels of CCL20 in the CNS during acute inflammation [16,17]. Consequently, CCR6-CCL20 axis has been suggested as a novel therapeutic target for NMDAR-Ab-E [3]. Our observation of lower frequencies of CCR6+ EM Tregs and a trend to lower frequencies of CCR6+ Tregs in NMDAR-Ab-E patients could indicate a genuine deficiency of CCR6 in these patients and this could have therapeutic implications. A more likely possibility is that this finding could reflect artificially low circulating levels of these Treg populations due to their recruitment to the CNS. Notably, Zeng et al. [3] demonstrated a significant increase in CCR6 expression by Th17 cells in the CSF but not peripheral blood of NMDAR-Ab-E patients and showed that addition of CCL20 significantly promoted the chemotactic ability of Th17 cells. Nonetheless, the exact relevance and implications of our findings are unclear and warrant further investigation.
The main limitations of this study are the potential confounding effects of steroid and plasma exchange therapy, and the small sample size. Due to the logistical challenges of CSF sampling particularly from healthy controls and the low numbers of lymphocytes found in the CSF in encephalitis, we focused on investigating the Treg population in peripheral blood. Findings in peripheral blood may not reflect activity in the CNS but it is likely the autoimmunization in these patients begins in the periphery [1].
Our preliminary data suggest that Tregs may have a role in the pathogenesis of NMDAR-Ab-E. It is not clear whether these findings are part of the disease pathogenesis in NMDAR-Ab-E implying that patients might benefit from modifying the Treg response, or just a response to the disease with no negative pathological consequence. Further studies in a larger cohort of patients using paired blood and CSF samples are necessary to confirm these observations and to elucidate the functional relevance of these findings.
Notes
Conflicts of Interest
Irani SR is an inventor of ‘Diagnostic Strategy to improve specificity of CASPR2 antibody detection (PCT/G82019/051257)' and receives royalties on a licensed patent application for LGI1/CASPR2 testing as co-applicant (PCT/GB2009/051441) entitled “Neurological Autoimmune Disorders.” Irani SR has received honoraria and/or research support from UCB, Immunovant, MedImmun, Roche, Janssen, Cerebral therapeutics, CSL Behring, and ONO Pharma. Iro MA is funded by Health Education England (HEE) / NIHR for this research project. No other potential conflict of interest relevant to this article was reported.
Author Contributions
Conceptualization, Investigation, Data curation, Formal analysis, Methodology, Funding acquisition, Validation: Iro MA; Supervision: Rollier CS, Irani SR, Sadarangani M, Pollard AJ, Clutterbuck EA; Acquisition of clinical data: AA; Writing–-original draft: Iro MA; Writing–review & editing: all authors
Acknowledgements
Iro MA was supported by the Thrasher Research Fund Early Career Award (award No. 12512) to undertake this project. Al-Diwani AA was funded in whole or part by the Margaret Temple BMA grant (2017), the National Institute for Health Research (NIHR) Oxford Biomedical Research Centre, and Wellcome Trust training fellowship (205126/Z/16/Z). Irani SR and this research were funded in whole or in part by a senior clinical fellowship from the Medical Research Council (MR/V007173/1), Wellcome Trust Fellowship (104079/Z/14/Z), BMA Research Grants-Vera Down grant (2013), and Margaret Temple (2017), Epilepsy Research UK (P1201), the Fulbright UK-US commission (MS-Society research award), and by the NIHR Oxford Biomedical Research Centre. For the purpose of Open Access, the author has applied a CC BY public copyright license to any Author Accepted Manuscript version arising from this submission. The views expressed are those of the author(s) and not necessarily those of the NHS, the NIHR, or the Department of Health.

