Eco-epidemiological risk factors for Japanese encephalitis in the endemic region of North East India: a hospital-based case-control study
Article information

Abstract
Purpose
Japanese encephalitis (JE) has emerged as a major public health concern in North East India due to its complex eco-epidemiological risk factors. The objective of this study was to understand the various risk factors associated with JE infection in the endemic study location.
Methods
A hospital-based case-control study was conducted at Jorhat Medical College and Hospital from August 2017 to September 2018. The study participants included 49 confirmed JE cases with two control arms, one consisting of non-JE acute encephalitis syndrome (AES) patients (n = 91) and the other of non-JE non-AES patients (n = 140), admitted at the same time in the pediatric and medicine wards. A predesigned, pretested, structured questionnaire was used for data collection.
Results
Univariate analysis revealed the following to be risk factors: age at onset, sex, religion, immunization status, proximity to pigs, proximity to paddy fields (<100 m), use of a mosquito net, impregnated mosquito net, mosquito repellent, and outdoor activities. Multiple logistic regression analysis identified age at onset (adjusted odds ratio [AOR], 20.900; 95% confidence interval [CI], 2.210–31.815) and proximity to pigs (AOR, 4.190; 95% CI, 1.592–11.040) as risk factors for the first control arm and proximity to paddy fields (<100 m) (AOR, 8.470; 95% CI, 2.0251–35.438) was the only risk factor found for second control arm, whereas impregnated mosquito nets (AOR, 0.082; 95% CI, 0.009–0.725) and mosquito repellent (AOR, 0.173; 95% CI, 0.052–0.575) were found to be associated with the second control arm.
Conclusion
Age at onset, proximity to pigs, proximity to paddy fields (<100 m), impregnated mosquito nets, and mosquito repellent were the most significant risk factors for JE in the NE region to warrant public health actions.
Introduction
Japanese encephalitis (JE) is mosquito-borne viral encephalitis that occurs in temperate and tropical regions of Asia and is maintained in a cycle of virus transmission between vertebrate-amplifying hosts (e.g., pigs, herons, and egrets) and several Culex mosquito species [1]. It is a leading viral cause of acute encephalitis syndrome (AES) in Asia [2]. In India, JE is endemic in 201 districts of 21 states, of which Assam, Bihar, Tamil Nadu, Uttar Pradesh, and West Bengal have been reporting outbreaks, contributing 80% of the disease burden [3]. The disease is highly fatal if early supportive care is not provided; the case fatality rate ranges from 0.3% to 60%, and frequent residual neuropsychiatric damage is seen in survivors (50%–70%) [4].
Assam has witnessed the highest number of JE and AES cases in the country. According to the Union Health Ministry, Assam registered 435 AES cases and 80 deaths and 212 JE cases and 39 deaths till September 2021. Assam accounts for 60.2% and 76.4% of the total AES and JE deaths, respectively, in the country [5]. JE is also endemic in neighboring NE states like Manipur, Nagaland, and Arunachal Pradesh [6]. According to the annual report of 2016–2017 (provisional list) by the North East Region’s Ministry of Health and Family Welfare, the numbers of cases and deaths for AES and JE for the respective states are as follows: Assam (AES, 1,713 cases and 187 deaths; JE, 416 cases and 85 deaths), Manipur (AES, 475 cases and one death; JE, 44 cases and one death), Nagaland (AES, no cases or deaths; JE, no cases or death), and Arunachal Pradesh (AES, one case and no deaths; JE, no cases or deaths) [6].
JE has emerged as a major public health concern in India due to its complex eco-epidemiology [7]. Furthermore, there are numerous gaps in our understanding of the eco-epidemiological risk factors associated with JE infection; therefore, this study was undertaken to assess the risk factors associated with JE infection in NE states.
Methods
This study was approved by the Institutional Ethics Committee (Human) of Jorhat Medical College and Hospital, Jorhat, Assam (No/AMC/EC/10196). Written informed consent was obtained from the parents/guardians of all study participants.
Selection of cases and controls
A case-control study was conducted among hospitalized patients admitted to the Pediatric and Medicine wards of Jorhat Medical College and Hospital (JMCH). All 49 serologically confirmed JE cases (case arm) and 91 cases of AES without JE (control arm 1) identified in JMCH from 2017 to 2018 were included in the study; another 140 patients admitted in those same wards for other medical conditions during the same time period (control arm 2) were included in our study. Patients not willing to give consent were exempted.
A case of AES is defined as a person of any age, at any time of the year, with acute onset of fever and change in mental status (including symptoms such as confusion, disorientation, coma, or inability to talk), and/or new onset of seizures (excluding febrile seizures). Other early clinical findings may include irritability, somnolence, or abnormal behavior greater than that seen with usual febrile illness [7]. A laboratory-confirmed case of JE is one who fulfills any of the following markers: (a) presence of immunoglobulin M (IgM) antibody in serum and/or cerebrospinal fluid (CSF) to a specific virus including JE/enterovirus or others, (b) four-fold difference in IgG antibody titer in paired sera, (c) virus isolation from brain tissue, (d) antigen detection by immunofluorescence, or (e) nucleic acid detection by polymerase chain reaction [3]. A probable or suspected case of JE is one who is in close geographic and temporal relationship to a laboratory-confirmed case of AES/JE in an outbreak. Patients failing to meet the above criteria for JE cases were confirmed as non-JE AES. Patients who were admitted to the above-mentioned wards for other medical conditions were recruited into the non-JE non-AES control group.
Serum specimens and CSF were tested for detection of JE-specific IgM antibody. All specimens were tested in the laboratory of the Department of Microbiology, JMCH. All blood/CSF samples used in this study were collected by the attending physician. Detection of IgM antibodies in serum and CSF to JE virus (JEV) was investigated using a commercially available qualitative enzyme-linked immunosorbent assay (ELISA) kit. JE diagnosis was confirmed on detection of JE-specific IgM antibody in a single sample of CSF and/or serum by Mac ELISA during the acute illness of AES.
Data collection
Data on potential risk factors for JE were collected by interviewing the patients/parents/guardians among both cases and controls using the same predesigned, pretested, and structured questionnaire. The structured questionnaire consisted of sociodemographic variables such as age, sex, caste, and residency; in addition, data on behaviors affecting exposure to the peridomestic mosquito population, such as outdoor activities, use of bed nets, use of mosquito repellent, proximity to paddy fields (<100 m), use of impregnated mosquito nets, and proximity to pigs were collected. Before interviewing the participants, informed consent was obtained.
Statistical analysis
The baseline data were expressed as overall means of continuous variables such as age or as frequencies of categorical variables such as sex, ethnicity, and residency. To evaluate the associations between the potential risk factors with the occurrence of JE, both univariate and multivariate analyses were used. A logistic regression model was used for calculation of maximum likelihood estimates of the odds ratio (OR) [8] using IBM SPSS version 23.0 (IBM Corp, Armonk, NY, USA). Factors that differed between cases and controls at a significance level of p < 0.2 in the univariate analyses were included in the multivariate logistic analyses. The final model was fitted using a stepwise selection procedure that included all significant variables with a p-value of ≤0.05 [8]. The goodness-of-fit of this model was assessed according to the Hosmer-Lemeshow test [9]. Two-sided statistical tests were used. Coefficients for independent variables were exponentiated to estimate ORs, and standard errors for the coefficients were used to estimate 95% confidence intervals (CIs) for the ORs. The p-value of ≤0.05 was considered to be statistically significant for all inferential statistics.
Results
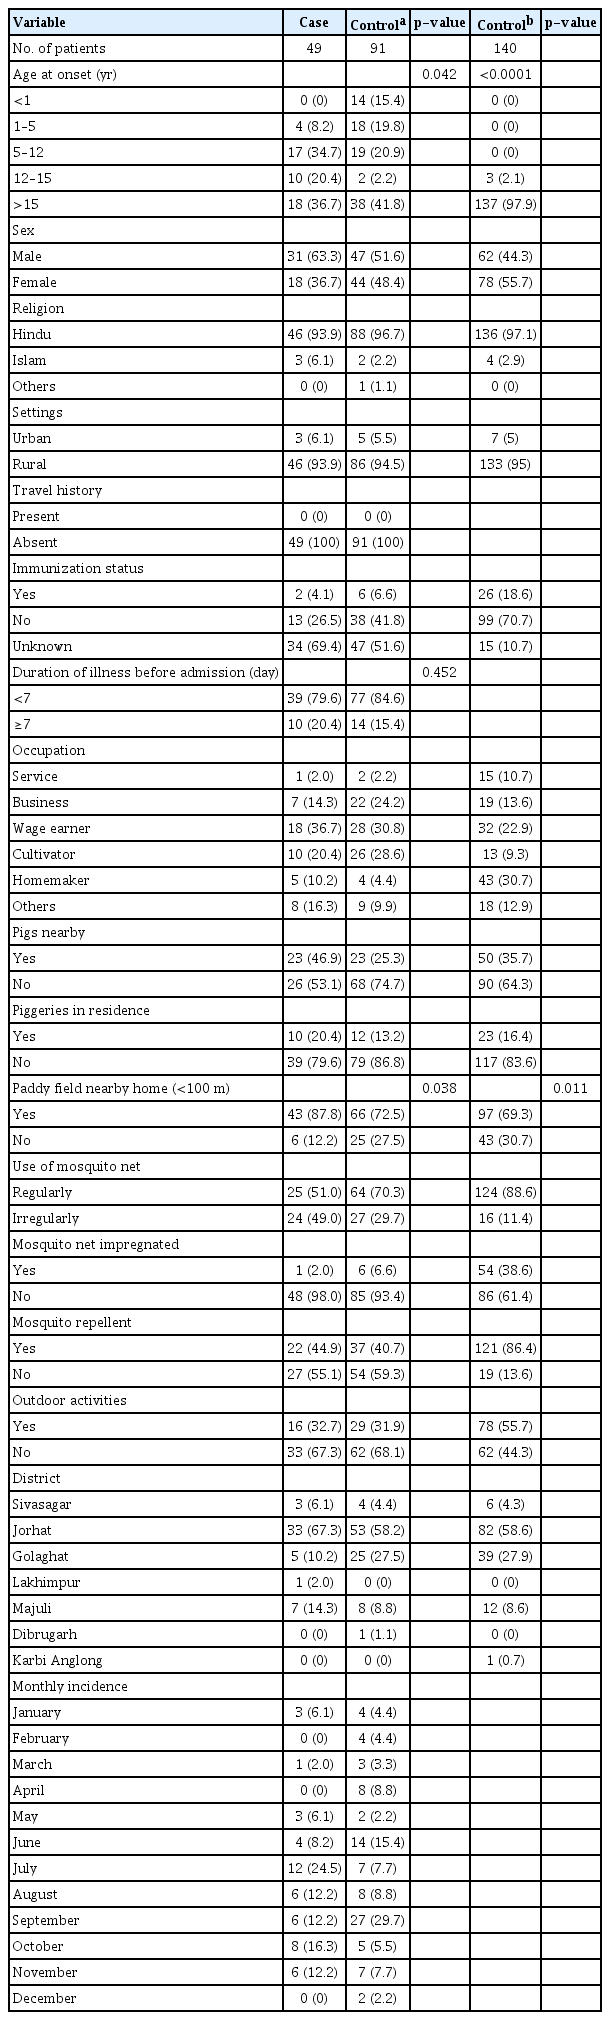
The present hospital-based case-control study included 49 confirmed JE cases in the case arm and 91 non-JE AES cases and 140 non-JE non-AES cases in control arms 1 and 2, respectively. Comparison of sociodemographic characteristics of cases and controls in arm 1 and arm 2 showed the following results: a majority of the participants belonged to the >15-year age group, 93.9% of cases vs. 94.5% of participants in control arm 1 and 95.0% in control arm 2 lived in rural areas, males comprised 63.3% in cases vs. 51.4% in control arm 1 vs. 44.3% in control arm 2, and Hindu religion comprised 93.9% in cases vs. 96.7% in control arm 1 vs. 97.1% in control arm 2.
Table 1 shows the result of univariate analysis for JE risk factors. The study extracted data on 17 potential risk factors for JE. Out of these, a total of five and 10 risk factors were found to be significant for the non-JE AES and non-JE non-AES control arms, respectively. The risk factors which were found to be significant for the non-JE AES arm were age at onset (OR, 10.560; 95% CI, 2.092–53.257; p = 0.042), sex (OR, 1.610; 95% CI, 0.791–3.280; p = 0.188), religion (OR, 0.348; 95% CI, 0.056–2.160; p = 0.168), immunization status (OR, 0.461; 95% CI, 0.088–2.423; p = 0.059), proximity to pigs (OR, 2.615; 95% CI, 1.256–5.447; p = 0.009), proximity to paddy fields (<100 m) (OR, 2.714; 95% CI, 1.028–7.163; p = 0.038), and use of mosquito nets (OR, 0.439; 95% CI, 0.214–0.9013; p = 0.024). Similarly, the significant risk factors for the non-JE non-AES control arm were age at onset (p < 0.0001), sex (OR, 2.167; 95% CI, 1.109–4.233; p = 0.023), immunization status (OR, 0.034; 95% CI, 0.007–0.161; p < 0.0001), proximity to pigs (OR, 1.590; 95% CI, 0.082–3.078; p = 0.009), proximity to paddy fields (<100 m) (OR, 3.177; 95% CI, 1.258–3.024; p = 0.011), use of mosquito nets (OR, 0.134; 95% CI, 0.063–0.289; p < 0.0001), impregnated mosquito net (OR, 0.033; 95% CI, 0.004–0.250; p < 0.0001), mosquito repellent (OR, 0.128; 95% CI, 0.061–0.269; p < 0.0001), and outdoor activities (OR, 0.385; 95% CI, 0.194–0.764; P = 0.004).
Comparison of characteristics for risk factors between JE cases, non-JE AES, and non-JE non-AES in Jorhat, Assam
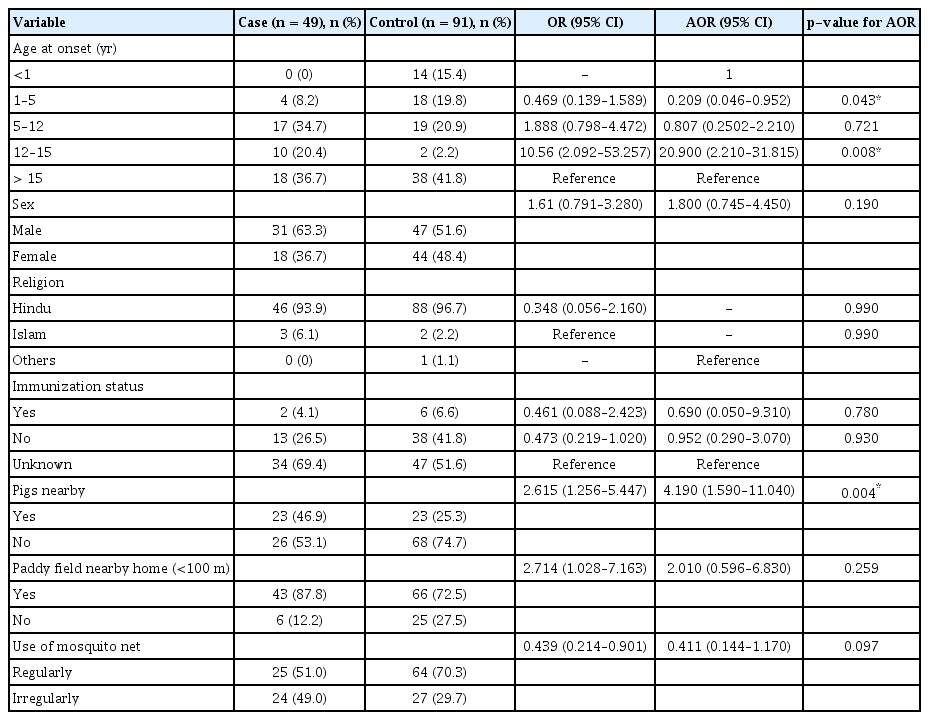
The results of multiple logistic regression analysis between JE cases and the non-JE AES control arm for risk factors associated with JE infections are depicted in Table 2. The reduced logistic regression model included seven risk factors that were found to be significant during univariate analysis: age at onset, sex, religion, immunization status, proximity to pigs, proximity to paddy fields (<100 m), and use of mosquito nets. Of these seven risk factors included in the model, two risk factors were found to be significant at α < 0.05: age at onset for the 1–5-year age group (adjusted OR [AOR], 0.209; 95% CI, 0.046–0.952) and the 12–15-year age group (AOR, 20.900; 95% CI, 2.210–31.815), and proximity to pigs (AOR, 4.190; 95% CI, 1.590–11.040).
Multivariate logistic regression analysis between JE and non-JE AES for JE risk factors
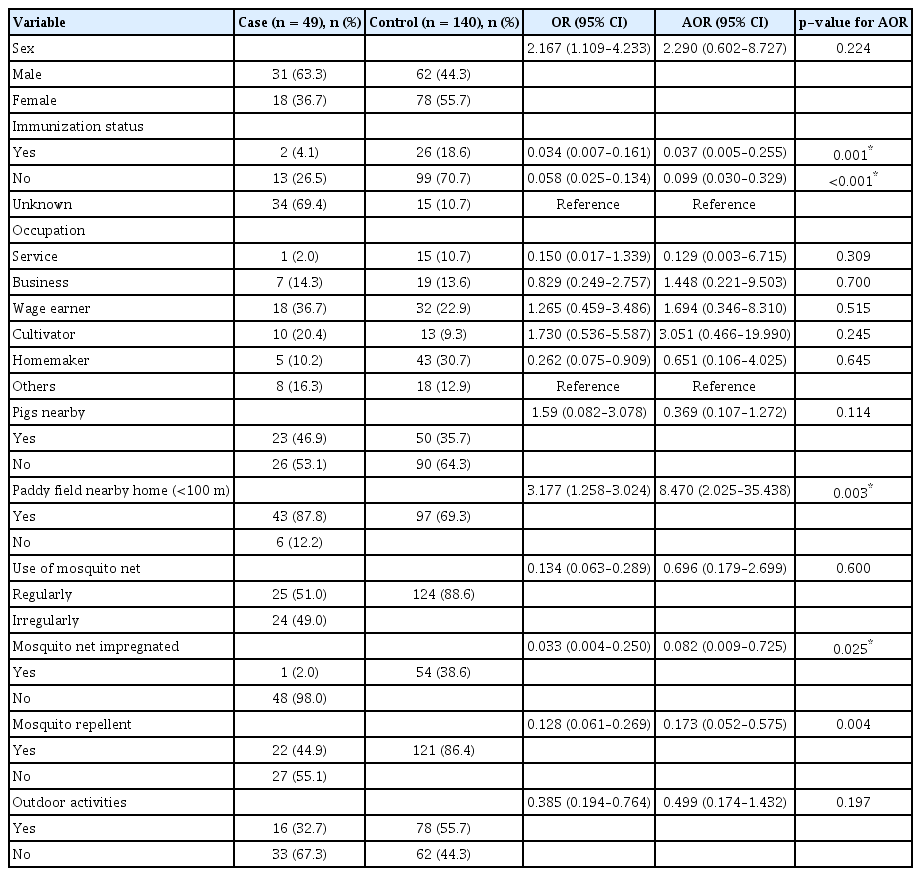
The results of multiple logistic regression analysis between JE cases and the non-JE non-AES control arm for risk factors associated with JE infection are depicted in Table 3. The reduced logistic regression model included 10 risk factors: age at onset, sex, immunization status, occupation, proximity to pigs, proximity to paddy fields (<100 m), impregnated mosquito nets, use of mosquito nets, mosquito repellent, and outdoor activities. Of these 10 risk factors included in the model, one risk factor was found to be significant at α < 0.05: proximity to paddy fields (<100 m) (AOR, 8.470; 95% CI, 2.0251–35.438), whereas impregnated mosquito nets (AOR, 0.082; 95% CI, 0.009–0.725), and mosquito repellent (AOR, 0.173; 95% CI, 0.052–0.575) were found to be associated with JE infection.
Multivariate logistic regression analysis between JE and non- E non-AES for JE risk factors
Discussion
We conducted a hospital-based, unmatched case-control study to determine the risk factors associated with JE infection at a tertiary hospital in Jorhat, Assam. Univariate analysis was done to identify risk factors, and ORs were calculated. Statistically significant risk factors were then analyzed by multiple logistic regression analysis, and AORs were calculated.
As far as the association of the demographic factor age with JE infection was concerned, we found that participants belonging to the 1–5-year age group and the 12–15-year age group were at the greatest risk of developing JE. A similar finding was stated in a review article conducted by Tiwari et al. [10], that JE is mostly a disease in children and young adults. Rates of infection in the 3–15-year age group are five to 10 times higher than in older individuals because of high background immunity in older individuals. Epidemics in nonendemic regions have affected all age groups, but a bimodal age distribution (young children and elderly) typically appears, indicating an increased risk in elderly people [10,11].
In our study, we found an association of JE infection with pigs residing nearby (AOR, 4.190; 95% CI, 1.590–11.040), indicating its role as a potential risk factor; similar observations were made by Liu et al. [12]. Another study conducted by Ren et al. [13] found that the minimum infection rate of JEV in mosquito specimens collected from the courtyards of households with pigsties was 7.39/1,000, the rate for pig farms was 2.68/1,000 and the rate for courtyards without pigsties was zero.
In the present study, immunization status (AOR, 0.099; 95% CI, 0.030–0.329) has been found to be associated with JE infection. A similar finding from a study conducted by Kakoti et al. [14] stated that nonimmunized people were at higher risk of infection with JEV. The authors also mentioned that JE infection was more pronounced among children with no vaccination history (78.5%) than those with an unknown history of vaccination (11%). From 2006 to 2007, Assam, India completed a vaccination campaign for children aged 1–15 years in all the districts and vaccinated more than 8.7 million children. For the 0–1-year age group and 1–2-year age group, routine vaccination is being carried out in all endemic districts of India. An adult JE vaccination campaign was introduced for individuals aged 15–65 years in 13 endemic districts of Assam, and about 6.4 million adult beneficiaries were vaccinated in the years 2013–2014 and 2015–2016 [15].
In our study, we found that people using impregnated mosquito nets (AOR, 0.082; 95% CI, 0.009–0.725) were at a lower risk of contracting JE infection. Similar findings were reported in a study conducted by Dutta et al. [16], who found that there was a significant reduction in human seroconversion in all three intervention localities compared with the non-intervention locality (p < 0.001). The relative risk (RR) in the locality (Kollolua) using insecticide-treated mosquito nets (ITMNs) in both human dwellings and pigsties was (RR, 0.28; 95% CI, 0.16–0.49), which was a 72% reduction of seroconversion compared with the non-intervention locality. The Athabari locality, where only humans were covered under ITMNs, and the Rajmai locality, where only pigs were covered under ITMNs, exhibited reductions of 67% (RR, 0.33; 95% CI, 0.20–0.56) and 56% (RR, 0.44; 95% CI, 0.28–0.71), respectively [16].
Our study was an unmatched case-control study where we interviewed both cases and controls about their prior exposure to risk factors of the disease. For the non-JE non-AES controls, matching on age and sex to the JE group might have provided more useful results. We included questions on known risk factors of the disease. Although the research associates were blinded to the study hypothesis and administered a structured questionnaire to all study subjects, we could still expect cases to selectively and differentially report on their exposure status for various risk factors. This could result in a differential misclassification and bias the effect estimate away from the null value.
In conclusion, age at onset, proximity to pigs, proximity to paddy fields (<100 m), impregnated mosquito nets, and mosquito repellent were the most significant factors affecting JE risk in our study. Identification of risk factors for JE infection would help in setting guidelines as well as creating awareness regarding the prevention and control of JE infection among the general population. Both of these strategies could contribute to reducing the incidence of JE infection in the concerned study area as well as formulating immediate public health actions.
Notes
Conflicts of Interest
No potential conflict of interest relevant to this article was reported.
Author Contributions
Conceptualization, Investigation, Project administration: Das BR, Biswanath P; Data curation, Visualization: Das BR, Kakoti G; Formal analysis, Software: Kakoti G, Chetri M; Funding acquisition, Resources, Supervision, Validation: Das BR; Methodology: Das BR, Kakoti G, Biswanath P; Writing–original draft: Das BR, Kakoti G, Chetri M; Writing–review & editing: all authors.
Acknowledgements
The authors would like to acknowledge all the research participants who gave consent to participate in this study. We duly acknowledge the administrative authority of Jorhat Medical College, Jorhat, Assam, India, for permitting us to carry out the proposed research work at the study site. The authors are also grateful to the Indian Council of Medical Research (ICMR), Government of India, for providing the grant to conduct the study. The authors would like to thank all the medical staff of the Pediatric and Medicine Wards of Jorhat Medical College and Hospital for their support.