Improving performance robustness of subject-based brain segmentation software
Article information
 , Dongmin Kim1, Myungjae Lee1, Shinuk Kang1, Seung Joo Kang4, Dae Hyun Yoon5, for the Alzheimer’s Disease Neuroimaging Initiative*
Abstract
Purpose
Artificial intelligence (AI)-based image analysis tools to quantify the brain have become commercialized. However, insufficient data for learning and scanner specificity is a limitation for achieving high quality. In the present study, the performance of personalized brain segmentation software when applied to multicenter data using an AI model trained on data from a single institution was improved.
Methods
Preindicators of brain white matter (WM) information from the training dataset were utilized for preprocessing. During learning, data of cognitively normal (CN) individuals from a single center were utilized, and data of CN individuals and Alzheimer disease (AD) patients enrolled in multiple centers were considered the test set.
Results
The preprocessing based on the preindicator (dice similarity coefficient [DSC], 0.8567) resulted in a better performance than without (DSC, 0.7921). The standard deviation (SD) of the WM region intensity (DSC, 0.8303) had a more substantial influence on the performance than the average intensity (DSC, 0.6591). When the SD of the test data WM intensity was smaller than the learning data, the performance improved (0.03 increase in lower SD, 0.05 decrease in higher SD). Furthermore, preindicator-based pretreatment increased the correlation of mean cortical thickness of the entire gray matter between Atroscan and FreeSurfer, and data augmentation without preprocessing did not.Both preindicator processing and data augmentation improved the correlation coefficient from 0.7584 to 0.8165.
Conclusion
Data augmentation and preindicator-based preprocessing of training data can improve the performance of AI-based brain segmentation software, both increasing the generalizability and stability of brain segmentation software.
Introduction
Cortical thinning and regional atrophy of the brain is associated with various health conditions, such as long-standing hypertension [1], diabetes [2], obesity [3], neurodegenerative disease, and normal aging [4]. Neuroinflammation has been suggested as a plausible mechanism of cortical thinning [4].
Quantitative characterization of the brain in neurodegenerative diseases, such as Alzheimer disease (AD), has been performed using cortical and hippocampal segmentation and visualized on magnetic resonance imaging (MRI). For brain imaging, statistical parametric mapping and FreeSurfer have been widely used [5]. Recently, image data with processing techniques and deep learning methods have been used for research in various ways. Studies based on convolutional neural networks (CNNs) have mainly focused on deep learning using medical images [6–8]. These methods perform well in detecting brain tumors and stroke lesion segmentation [9,10]. In dementia, factors such as segmentation, gray matter (GM) tissue maps, and cortical thickness, have high predictive value in AD. Therefore, determining how segmentation can be improved is critical to achieving accurate clinical decisions. Deep learning analysis of MRI can potentially assist in detecting biomarkers before the appearance of dementia symptoms which can help clinicians determine a confirmatory diagnosis. In addition, image biomarkers can be utilized for disease assessment, differential diagnosis, monitoring, and treatment [11]. However, obtaining a sufficient number of medical images for artificial intelligence (AI) learning is difficult. Furthermore, the AI models may have low performance if the images utilized for learning are acquired using different procedures and scanners at multiple institutions with insufficient variability in resolution, noise, and tissue appearance [12,13].
To address these issues, images should be standardized with preprocessing methods, such as brain registration, warping, and voxel-based morphometry [14–16]. In addition, data augmentation, which increases the sample responsiveness of a model, can be applied [17–19]. However, verifying whether an AI model exhibits satisfactory performance before implementing these methods is difficult. Therefore, we developed a system that complements model performance using preliminary indicators. The preindex system used in this study includes GM as the detection object and white matter (WM) as the preindicator.
In our preliminary indicator hypothesis, signals acquired in medical images have characteristic information based on devices and acquisition methods. Data derived from a specific area have a higher signal-to-noise ratio (SNR) than that obtained from the entire image. The performance of AI models generally decreases when external data are used without training. Furthermore, converting the external data based on the characteristics of the training data improves performance.
In the present study, brain WM was used as a preindicator because it occupies an extensive area in the brain compared with the cortex or other specific areas. Furthermore, the intensity of this area appears relatively uniform on MRI scans. Because this area is large, even if some portions of the WM are not detected, or other small areas are falsely detected, the effect on the average and standard deviation (SD) of all the divided pixels would be small. Preindicator-based preprocessing and data augmentation were utilized to improve model-based segmentation processes and improve software-based clinical evaluations and diagnostic efficacy.
Methods
This study was performed in accordance with the Declaration of Helsinki. The study was approved by the Institutional Review Board of Seoul National University Hospital (No. 1712-038-905) and written informed consent was waived due to its retrospective nature.
Dataset preparation
Alzheimer’s Disease Neuroimaging Initiative
Data used in these analyses were obtained from the Alzheimer’s Disease Neuroimaging Initiative (ADNI) database (http://www.loni.ucla.edu/ADNI/Data/index.shtml, adni.loni.usc.edu), a publicly available database launched in 2003 as a public-private partnership. MRI T1 sagittal data (n = 480) were collected. The data were labeled during the data acquisition process. Subjects were divided into cognitively normal (CN, n = 204) and AD (n = 276) groups. The demographics of the study population are shown in Table 1.
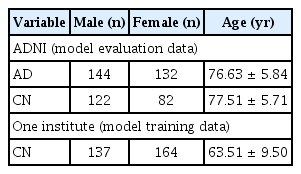
The demographic data for the training dataset
Local medical check-up center
Another dataset of MRIs from 301 individuals (male, 137 and female, 164) was randomly selected from a healthy cohort in the Seoul National University Hospital Healthcare System Gangnam Center (IRB number, H-1712-038-905). Subjects who had undergone brain MRI including three-dimensional (3D) magnetization-prepared rapid gradient-echo sequence as part of dementia screening were considered. Whether the subjects were CN was determined with a comprehensive neuropsychological battery using the Korean version of the Consortium to Establish a Registry for Alzheimer’s Disease and clinical counseling by an experienced neurologist (Park KI) and psychiatrist (Yoon DH).
The local dataset was used for training and model selection and the ADNI data were used to evaluate the final model performance.
Data processing
Ground truth image segmentation
GM and WM in the brain were annotated using the FreeSurfer software package (version 6.0.0, available at http://surfer.nmr.mgh.harvard.edu), which was recently summarized by Fischl [20]; this software facilitates the automated parcellation of the brain cortex and subcortical structures. The GM and WM areas were automatically measured using FreeSurfer on a Linux workstation. The sagittal MRI was reformatted to an axial image and then converted to FreeSurfer mgz format. The procedure for GM and WM parcellation automatically assigns a neuroanatomical label to each voxel in an MRI volume based on probabilistic information estimated automatically from a manually labeled training set. The optimal linear transform was calculated by maximizing the likelihood of the input image. An atlas constructed from manually labeled images of 14 young and middle-aged subjects was utilized and nonlinear transformation was applied. Bayesian segmentation was performed and the maximum posteriori estimate of the labeling was determined.
Data augmentation
The factor considered during the data augmentation process was whether the image could occur. In general, for image data augmentation, several processes, such as translation, flipping, rotation, stretching, sharing, elastic deformation, and contrast augmentation were performed. However, because sharing and elastic deformation can alter the shape of the brain, and flipping did not significantly occur, 3D translation and rotation (n = 5) and contrast augmentation (n = 5) were performed. Finally, a dataset that was 10 times the data held was obtained. Translation and 3D rotation were performed by applying randomly generated values from the normal distribution of the average of 0 and the scale of 0.1 to the transformation matrix. The contrast augmentation shifted the average of the entire image by adding randomly generated values from the average distribution of 0 and the scale of 5 to intensity values between −20 and 20.
Gray matter and white matter segmentation training
Atroscan (http://jlkgroup.com/#/platform/aihub), which provides complete segmentation of the brain cortex and subcortical structures, was used for GM and WM segmentation. The Atroscan segmentation algorithm is shown in Supplementary Figure 1. The 3D U-Net has a downsampling and an upsampling path, each with four resolution steps. In the downsampling path, each layer has three 3 × 3 × 3 convolutions and batch normalization, which is followed by a rectified linear unit (ReLU) activation function, and a 2 × 2 × 2 max pooling layer for downsampling. In the upsampling path, each layer uses a deconvolution with a kernel size of 2 × 2 × 2, followed by three 3 × 3 × 3 convolutions and batch normalization with ReLU. The network has shortcut connections between corresponding layers with the same resolution in the downsampling and upsampling paths.
For the loss function, dice similarity coefficient (DSC) was used, a key measure to determine the performance for semantic segmentation and calculated as follows:
For model training, the initial value of the model was set as a random variable. During learning, 100 epochs were performed and the training model that showed the highest DSC in the test set was selected as the final model. Input data for learning were downloaded from data 256 × 256 × 256 to 128 × 128 × 128 in size. Each data point was used for learning after rescaling to have a maximum intensity of 255 and dividing the rescaled data point by the mean and SD of the entire data.
Before data augmentation, 80% of the single-center data were randomly selected. These data were reorganized into a data set multiplied 10 times with a data augmentation process and a data set that had not undergone augmentation. The remaining 20% of the data were used as a validation set to verify the performance of the model and applied to the collected ADNI data to evaluate whether a change in performance based on the pretreatment and data augmentation process on the WM occurred.
The DSC and correlation coefficient of the cortical thickness determined model performance. DSC evaluated model segmentation and the correlation coefficient determined model capabilities such as structural characteristics extraction.
Preprocessing methods using white matter
Brain WM was detected with a model of the same structure as the CNN model designed to segment the detection target. The average and SD of the area were measured. Accordingly, the 3D MRI data were shifted to the training mean and SD of the data. For comparison, the cortical GM, WM, and cerebrospinal fluid areas were determined.
where xinput, xoutput, xtrain_wm, xinput_wm, xinput_wm, nvoxel_train_wm, nvoxel_input_wm, ntrain denote the input MRI T1 image, preprocessing image, signal intensity under WM area of training data, signal intensity under WM area of input data, voxel number under WM area of training data, and the number of training data, respectively. The 255-upper area of xoutput was converted to 255 and the 0-under area of xoutput was converted to 0. Figure 1 depicts the preprocessing changes in representative images.

Representative images depicting changes due to preprocessing based on signal intensity of white matter
In cases with a small standard deviation (SD) of signal intensity, (A) white matter SD increased and (B) decreased in cases with large SD. (C) Representative figure of cortical thickness measurement. Images have been color-coded for visualization purposes only in this figure.
DSC, dice similarity coefficient.
Cortical thickness measurement
In the 3D space, 173 direction vectors were calculated, representing all the direction vectors that can occur in a 6 × 6 × 6 space and were measured under the assumption that cortical thickness does not exceed 6 mm. In addition, each pixel of the GM determined the minimum fulfilled direction [21]. The minimum length of each voxel eliminated the upper 90% and lower 10%. Furthermore, the minimum length group was averaged. When comparing our data with the FreeSurfer results, a Pearson correlation of 0.9623 (r-value) was obtained (Supplementary Figure 2).
Statistics
For statistical comparison, multicenter MRI data from ADNI were used. Two tests were performed to compare the performance of the preindicators. The change in DSC (ΔDSC) was evaluated with different techniques and the cortical thickness in dementia and nondementia groups was measured using each technique. A paired t-test and an independent t-test were used to compare the cortical thickness between dementia and nondementia groups. In addition, Cohen’s D was used to compare effect sizes based on differences between means as follows:
where x1, n1, and s1 denote the average of sample, sample number, and SD of the sample, respectively.
Results
Model performance evaluation using dice similarity coefficient
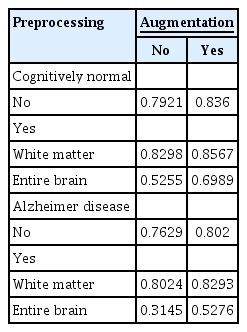
Whether DSC, an indicator of the model performance of GM segmentation, changes with data augmentation and WM preprocessing was investigated. Model performance was lower when multicenter data were validated using a model trained on data from a single institution. However, the performance improved with data augmentation during learning and WM-based preprocessing of the test data. The average DSC increased by approximately 0.06 when both methods were implemented (Table 2). When using a test dataset of dementia patients, the model algorithm performed well although it was trained on a CN database (Table 2). The ΔDSC after WM-based preprocessing (p < 0.001) and data augmentation (p < 0.001) was statistically significant with a t-statistic of 7.6762 after preprocessing and 6.2039 after data augmentation (paired t-test). Specifically, WM-based preprocessing enhanced the performance on test data with a lower WM intensity SD than training data. In the AD and CN groups, similar patterns were observed within each group. In the AD group, ΔDSC after treatment for lower SD (n = 164) was +0.0536, and ΔDSC for higher SD (n = 114) was −0.0863. In the CN group, ΔDSC at lower SD (n = 149) was +0.0457 and ΔDSC at higher SD (n = 55) was −0.0129. However, the differences between the groups were not statistically significant. Unlike WM-based preprocessing, data augmentation of learning data consistently increased DSC regardless of test data WM intensity SD (Figure 2). However, this pattern was not evident based on the average WM intensity of the training data (Supplementary Figure 3). Based on the above observations, we believe that adjusting SD with data augmentation, which performs intensity shift and rotation, can improve model performance. The performance with the single-center data was the highest (validation DSC, 0.9142), followed by the external multicenter CN validation (DSC, 0.8347) and AD (DSC, 0.7663) compared with pretreatment. This result indicated the internal validation performance improved from 0.9097 to 0.9142 compared with the model trained with augmentation and without SD adjustment; however, the external performance declined (DSC of CN validation, 0.8360 to 0.8347; DSC of AD validation, 0.8020 to 0.7663). In addition, model performance was analyzed using entire brain values as an indicator. Although the analysis was performed using the same process, the DSC with data augmentation was 0.6989 and 0.5255 without augmentation. Thus, considering brain WM, model performance was better.
Dice similarity coefficients according to preindicator case
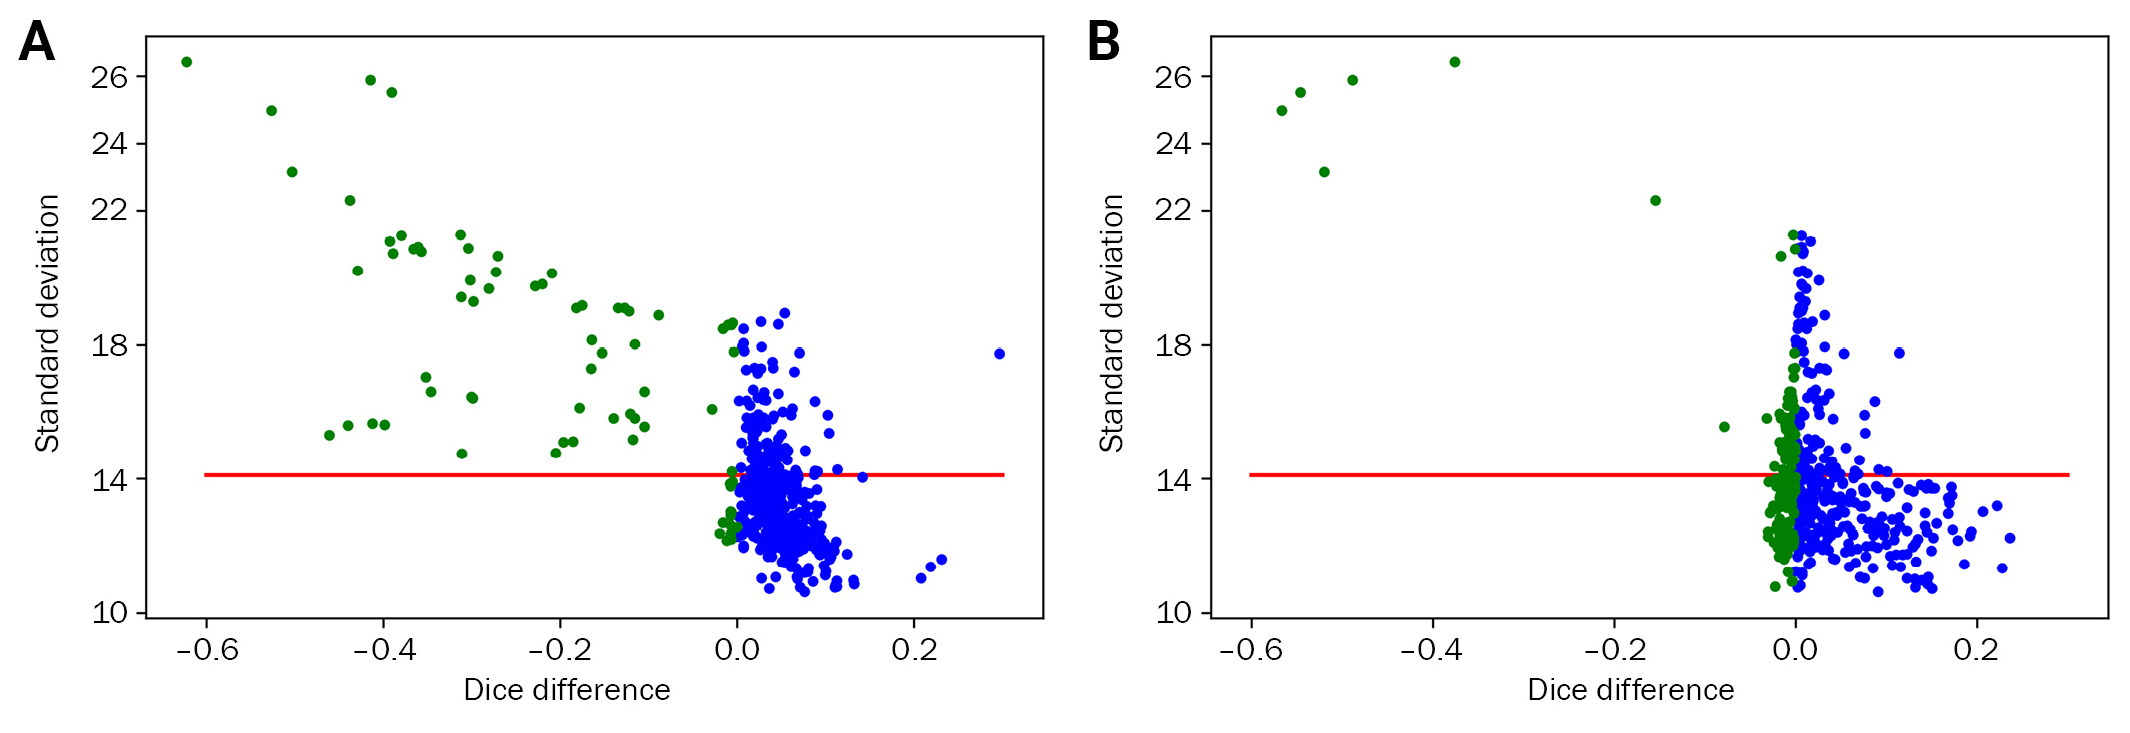
The difference in DSC based on white matter preprocessing>
(A) Without augmentation and (B) with augmentation (red line denotes the average standard deviation [SD] of the training set, green circles indicate DSC lower than 0, indicating worse performance by preprocessing). The population with higher SD than the training set showed decreased DSC after preprocessing; augmentation complemented this effect.
DSC, dice similarity coefficient.
When parcellation was taken into consideration, WM-based preprocessing did not show any meaningful positive effects. However, augmentation showed a significant increase in performance, where the values improved from 0.6475, 0.6436, 0.6383, and 0.5730 to 0.7226, 0.7075, 0.7293, and 0.6250 for the frontal, temporal, parietal, and occipital region, respectively (paired t-test, p < 0.001) (Supplementary Figure 4).
Data augmentation and white matter preprocessing improve correlation coefficient
In addition, whether data augmentation and WM preprocessing can alter the correlation coefficient that indicates model performance in the entire GM segmentation was investigated. When comparing the cortical thickness in AD and CN groups, the AD group showed significantly lower cortical thickness than the CN group in all index methods. Regarding t-values with augmentation and preprocessing, only preprocessing, only augmentation, and without augmentation and preprocessing were 16.764, 14.474, 12.206, and 13.404, respectively. Regarding Cohen’s D values with augmentation and preprocessing, only preprocessing, only augmentation, and without augmentation and preprocessing were 1.737, 1.499, 1.264, and 1.389, respectively (Figure 3). However, the correlation of cortical thickness between FreeSurfer and Atroscan varied in different situations. Although data augmentation increased the segmentation DSC, the correlation of cortical thickness decreased. However, for index-based preprocessing, the correlation of cortical thickness increased (Figure 4). The highest correlation (0.8165) between FreeSurfer and Atroscan was obtained with indicator processing as well as data augmentation (p < 0.001). A correlation coefficient of 0.7538 was obtained without augmentation and indicator processing (p < 0.001), and the correlation coefficient decreased to 0.6097 (p < 0.001) when only data augmentation was performed. When only indicator processing was performed without data augmentation, the value was 0.7584 (p < 0.001).
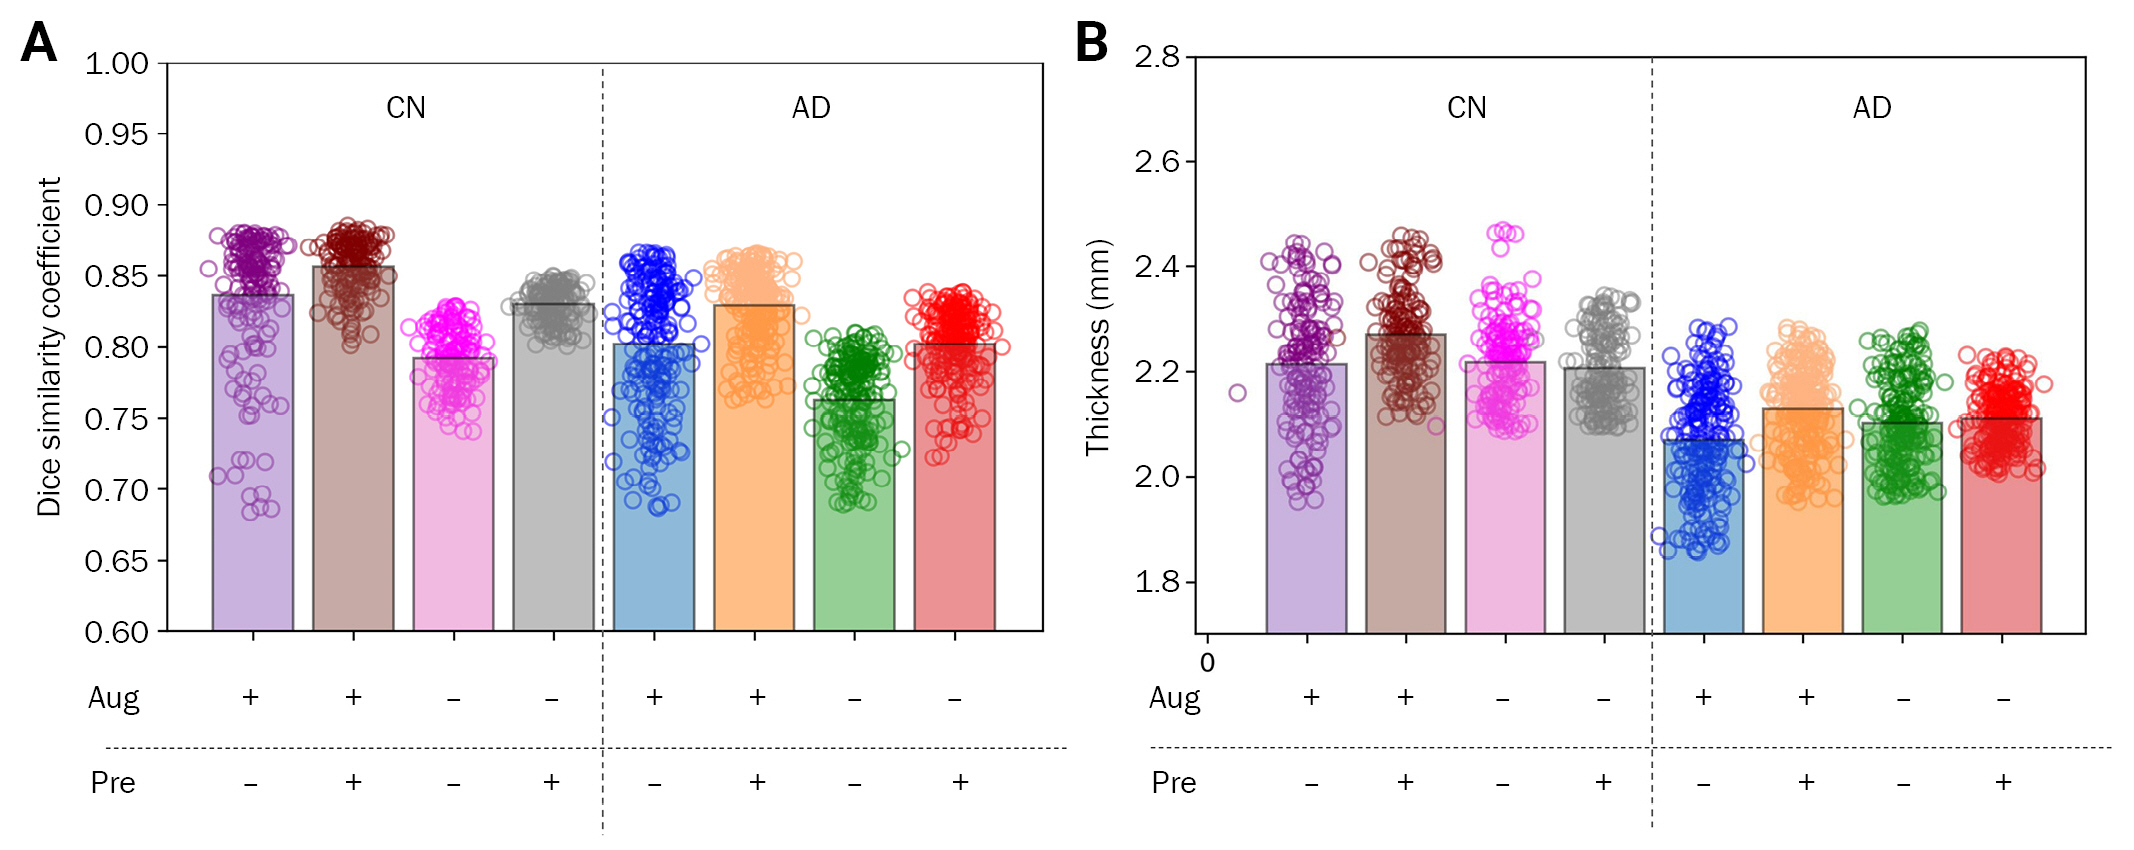
Cortical thickness comparison between AD and CN groups based on index methods
Dice similarity coefficient (A) and mean cortical thickness (B) based on different procedures.
Aug, augmentation; Pre, preprocessing; CN, cognitively normal; AD, Alzheimer disease.

Correlation of cortical thickness obtained from the developed model with FreeSurfer results
Cortical thickness was compared between Alzheimer disease and cognitively normal groups based on index methods. (A) Original image and no pre-processing [A(−) P(−)]. (B) Original image and pre-processing [A(−) P(+)]. (C) Augmentation and no pre-processing [A(+) P(−)]. (D) Augmentation and pre-processing of white matter [A(+) P(+)].
Freesurfer: version 6.0.0, available at http://surfer.nmr.mgh.harvard.edu.
Discussion
In the present study, preprocessing using preindicators was verified to improve model performance when a deep learning model trained on data from a single site was applied to data from multiple centers. To validate our preprocessing approach, uniform subjects with normal cognitive functions and data from a single institution with limited inter-device variability for learning were used.
The performance of AI solutions in studying dementia has been extensively studied. Applications of AI in accurately diagnosing dementia and classifying it into subtypes have been compared with doctors’ diagnoses [22-27]. Correlation analyses have been conducted in the segmentation area using programs such as arterial spin labeling, FreeSurfer [28], or manual segmentation [29]. The advancement of technology has increased analysis speed but generalizability can still be improved.
Data augmentation and preprocessing are widely used to improve the performance of medical image segmentation tasks. As the volume of training data decreases, this effect can be maximized [30]. In general, the state-of-the-art performance of the top-ranked methods of tissue segmentation in the iSeg-2019 challenge showed a dice coefficient of 0.85 in GM segmentation [31]; similar DSC scores were obtained in our method (DSC, 0.8567).
To test the first hypothesis that specific image areas may have a higher SNR and better information, preprocessing was performed with different preindicators, and the model learned from data of CN individuals at a single site. The test index as an indicator was brain WM and the control was the entire brain. When the brain WM region was used as a preindicator instead of the entire brain, the performance significantly increased. Thus, WM can alleviate some differences due to multiple devices.
The second hypothesis that characteristics of the external data can be converted to fit those of the training data to improve the performance of the AI model was also tested. Preprocessing utilizing the training data with or without data augmentation improved the model performance. Comparison with the DSCs of preprocessed and non-processed training data indicated the performance improved in areas with a lower SD than the training data. The performance in areas with higher SD was lower. These issues can be resolved with data augmentation; without preprocessing of the preindicator method, better performance can be obtained when the SD of the WM of the test set is higher than the training data.
Data normalization based on the learning condition may provide improved results in a condition-dependent manner. In addition, if a task matches the characteristics of the training data, the effect is based on SD data of intensity rather than the average intensity (Supplementary Figure 3). The SD indicates the variability of the amplitude and frequency and is less influenced by the shift effect [32]. Therefore, these features can affect the segmentation performance rather than average intensity.
In contrast, a notable trend was observed when the cortical thickness correlation was studied. The difference between the AD and CN groups was significant, however, the distribution of cortical thickness was wide when data augmentation was performed. Conversely, pretreatment narrowed the distribution of cortical thickness. When data augmentation and WM-based preprocessing were used simultaneously, the highest correlation value of the entire GM thickness between FreeSurfer and our model was obtained (Figure 4). The change in correlation due to preprocessing and data augmentation was mainly caused by segmentation because the cortical thickness measurement in the same segmentation was 0.9623 (Supplementary Figure 2). This showed that when the corresponding index was used to distinguish between the AD and CN groups, stable differences could be obtained only with data augmentation and preprocessing. Analysis of cortical thickness between the AD and CN groups showed that both the t-value and Cohen’s distance were highest when data augmentation and preprocessing were performed.
In the present study, a preprocessing method based on a preindicator to achieve better performance of AI algorithms was described. This technique, in addition to data augmentation, is useful for medical data analyses where obtaining sufficient data is difficult. This method showed a significant increase in performance under specific settings, thus, insights underpinning performance improvement using data augmentation is possible. Although the preprocessing method using only mean and SD was used, subsequently, other effects using different techniques should be evaluated. Because the mean and SD are important features of MRI intensity, they play an important role in GM segmentation. However, in GM parcellation, any influence of mean or SD of intensity after preprocessing was not found probably because parcellated areas had similar intensity. Therefore, in the future, whether the preindicator method will be useful in tasks other than intensity-based segmentation can be determined. Furthermore, these analyses can promote stable measurements of brain cortical thickness and further the development of advanced methodology for generalizing brain segmentation software.
Notes
Conflicts of Interest
Park JH, Kim D, Lee MJ, and Kang S are employees of the JLK. All were blinded to group allocation. Kang SJ, Yoon DH, Lee SK, and Park KI have nothing to disclose. Additional information for correspondence and requests for data should be addressed to Park KI.
Author Contributions
Conceptualization: Park KI, Kang SJ; Formal analysis: Park JH, Park KI, Kim DM, Lee M, Kang S; Visualization: Park JH, Kim DM, Lee M, Kang S; Investigation: Park KI, Park JH, Lee SK; Resources: Park KI, Kang SJ, Yoon DH; Supervision: Park KI, Yoon DH; Writing–original draft: Park JH; Writing–review and editing: all authors
Acknowledgements
Data collection and sharing for this project was funded by the Alzheimer’s Disease Neuroimaging Initiative (ADNI) National Institutes of Health Grant (U01 AG024904) and Department of Defense (DOD) ADNI (Award number W81XWH-12-2-0012). ADNI is funded by the National Institute on Aging, the National Institute of Biomedical Imaging and Bioengineering, and through generous contributions from the following: AbbVie, Alzheimer’s Association; Alzheimer’s Drug Discovery Foundation; Araclon Biotech; BioClinica, Inc.; Biogen; Bristol-Myers Squibb Company; CereSpir, Inc.; Cogstate; Eisai Inc.; Elan Pharmaceuticals, Inc.; Eli Lilly and Company; EuroImmun; F. Hoffmann-La Roche Ltd. and its affiliated company Genentech, Inc.; Fujirebio; GE Healthcare; IXICO Ltd.; Janssen Alzheimer Immunotherapy Research & Development, LLC.; Johnson & Johnson Pharmaceutical Research & Development LLC.; Lumosity; Lundbeck; Merck & Co., Inc.; Meso Scale Diagnostics, LLC.; NeuroRx Research; Neurotrack Technologies; Novartis Pharmaceuticals Corporation; Pfizer Inc.; Piramal Imaging; Servier; Takeda Pharmaceutical Company; and Transition Therapeutics. The Canadian Institutes of Health Research provides funds to support ADNI clinical sites in Canada. Private sector contributions are facilitated by the Foundation for the National Institutes of Health (www.fnih.org). The grantee organization is the Northern California Institute for Research and Education and the study is coordinated by the Alzheimer’s Therapeutic Research Institute at the University of Southern California. ADNI data are disseminated by the Laboratory for Neuro Imaging at the University of Southern California.
Supplementary Materials
Supplementary Figures 1 to 4 can be found via https://doi.org/10.47936.2022.00108.
Atroscan analysis flow chart
Cortical thickness correlation between Atroscan and Freesurfer
DSC difference according to white matter-based preprocessing method
Comparison of original model (Atroscan) and proposed methods in the parcellation results